
How it Works
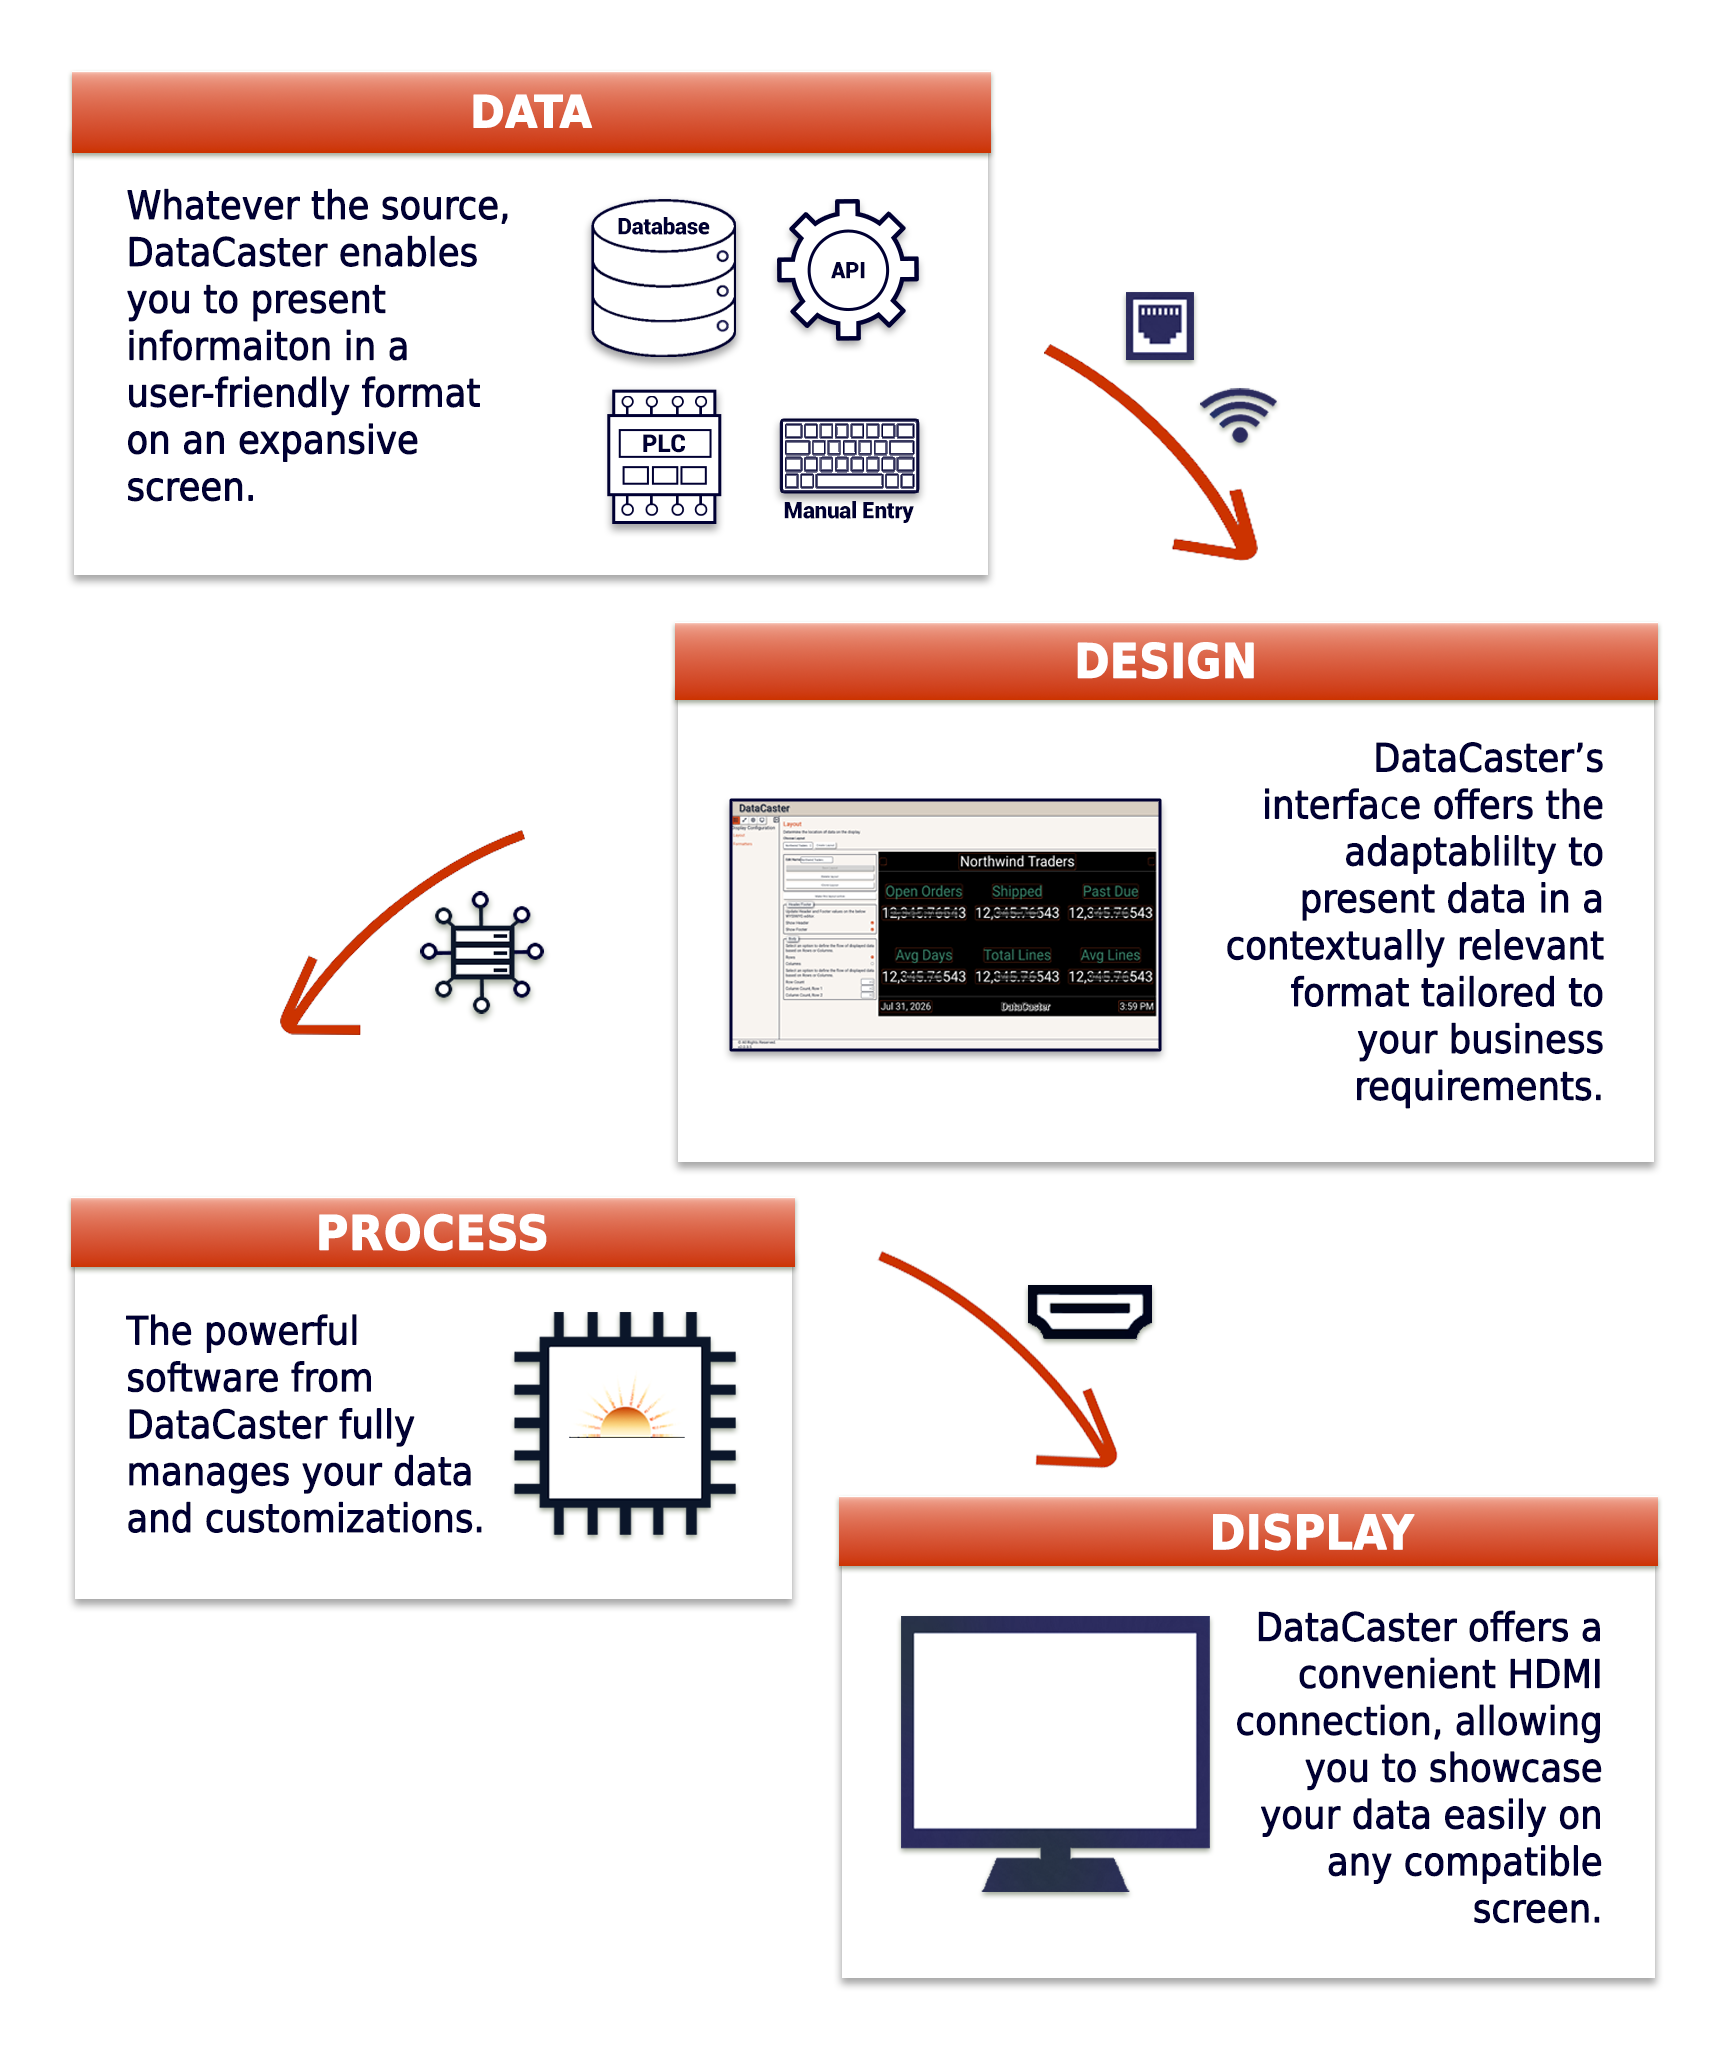
DataCaster turns data into clear, real-time visual dashboards. As a a standalone, edge computing device, DataCaster is designed to integrate seamlessly with your existing data sources, including:
- Manual inputs
- PLCs
- Databases
- APIs
Five simple steps will get you up and running with DataCaster:
Step 1: INITIAL SETUP
Initial setup is simple. Connect the device directly to an HDMI display/television and USB keyboard. From there, you can navigate the on-screen interface to:
- Select a wired or wireless network connection.
- Configure network settings.
- Assign a secure password.
This process establishes the foundation for secure and reliable operation.
Step 2: Connect to Your Data Sources
Initial setup is simple. Connect the device directly to an HDMI display/television and USB keyboardOnce the system is configured, the next step is to connect DataCaster to your data sources.
DataCaster supports multiple, simultaneous connections, allowing you to pull information from a variety of sources, including:
- PLCs
- SQL databases
- APIs
- Manual data entry
This flexibility ensures you can work within your existing infrastructure without a need for new systems or major changes.
Initial setup is simple. Connect the device directly to an HDMI display/television and USB keyboard. From there, you can navigate the on-screen interface to:
- Select a wired or wireless network connection.
- Configure network settings.
- Assign a secure password.
This process establishes the foundation for secure and reliable operation.
Step 3: Select & Access Your Data
After establishing connections, define exactly what data you want to use.
DataCaster provides multiple ways to access and interact with your data:
- Create and run SQL queries.
- Browse and connect to OPC tags.
- Retrieve or write data via API.
- Work with structured database tables.
This step allows you to focus on the specific metrics and values that matter most to your operation.
Step 4: Build Your Dashboard
With your data selected, you can configure how it will be displayed.
DataCaster enables you to:
- Create custom layouts.
- Organize data visually on the screen.
- Control how much information is displayed.
This ensures your dashboard is clear, relevant, and easy to understand at a glance.
Step 5: Format and Visualize
Finally, refine how your data appears on the screen.
Formatting options allow you to control:
- Numeric formatting (e.g., decimal places)
- Color changes based on values or thresholds
- Visual emphasis for key metrics
- Overall presentation and readability
The result is a dashboard that not only displays data, but makes it immediately actionable.
Up and Running
From setup to visualization, DataCaster allows you to turn data into actionable insight – simply, quickly, and effectively – right where it matters most.