Let’s start with something we can probably all agree on: spaceships are cool.
As we were building API functionality into DataCaster, we needed a data-rich subject with a reliable API we could use for testing. Enter: the International Space Station (ISS).
Why not have our test API track a spaceship traveling around the Earth at roughly 17,000 miles per hour? Since there are several organizations that provide public APIs reporting on the ISS’s current latitude and longitude, we chose to track that specific data. We wrote a simple background script that retrieves that information and sends it to DataCaster through our REST API.
From there, DataCaster can easily display the tracked information on a scoreboard or television. Of course, simply showing two numbers on a screen – without context – would not be much fun. That is where DataCaster’s formatters come in. A formatter takes raw data and adds context. It tells DataCaster how to display the information, turning a number into a gauge or speedometer or changing colors based on a value.
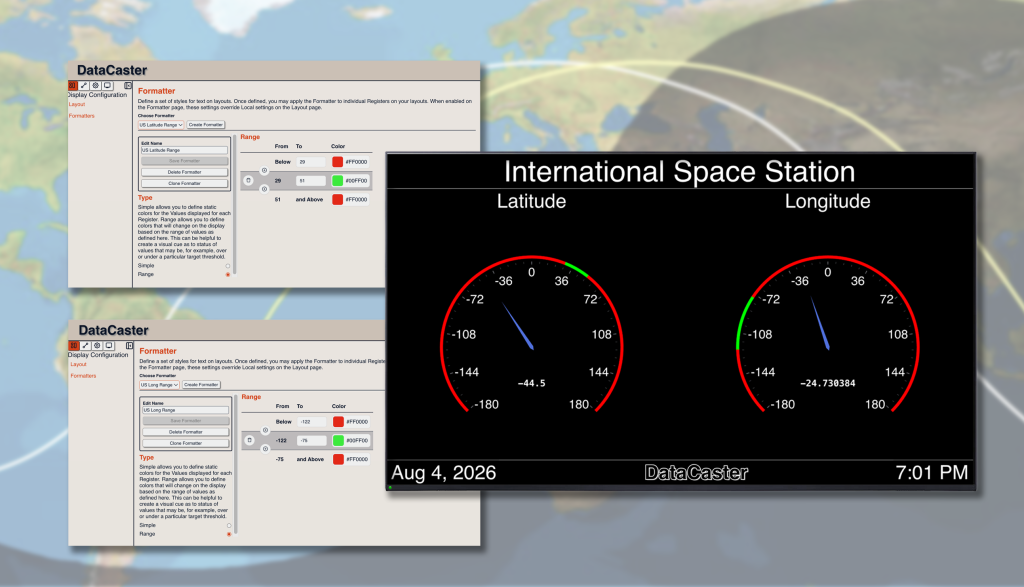
In our ISS example, DataCaster uses the latitude and longitude data to create a much more interesting visualization. We can show where the ISS is at a given time, and even highlight when it is passing above the United States.
Is tracking the International Space Station the most common manufacturing application for DataCaster? Probably not, but it is a pretty fun way to demonstrate what is possible.
Customers frequently ask us, “Do you support APIs?”
We answer, “Absolutely.”
You can send data to DataCaster through our published REST API. Once received, DataCaster can take that data and format it, color-code it, and turn it into a visualization that people can quickly understand.
Raw data is useful.
Raw data presented like a spaceship-tracking speedometer is even better.